
March 2026 was difficult for markets. West Asia tensions, soaring oil, and falling indices tested every investor’s resolve. Here is what the data says — and how a rules-based model can quiet the noise in your head.
“The investor’s chief problem — and even his worst enemy — is likely to be himself.” — Benjamin Graham, The Intelligent Investor
01 — WHAT HAPPENED
March 2026: A Month the Markets Would Rather Forget
Escalating West Asia tensions disrupted shipping through the Strait of Hormuz, a chokepoint for over 20% of global oil supply, pushing crude oil prices above $100 per barrel for the first time in recent memory. The resulting spike in energy prices, coupled with currency pressure and foreign fund outflows, triggered a cascading reaction across markets worldwide. What started as a geopolitical event quickly became an economic reality that markets had to price in, fast.
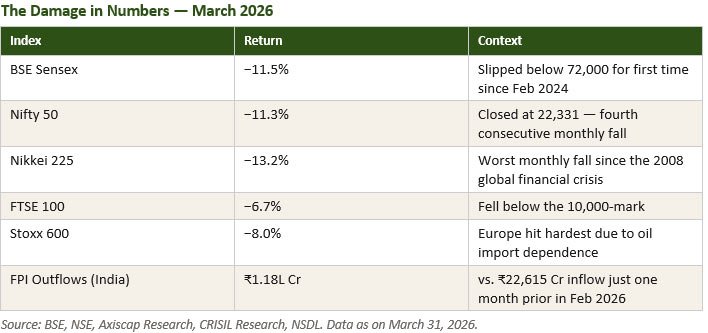
No market was spared. If you checked your portfolio during March and felt a knot in your stomach, that reaction is deeply human. The instinct to “do something”, sell, exit, pause SIPs, is one of the most natural responses to financial uncertainty. And yet, it is often a costly one.
02 — THE BEHAVIOURAL PROBLEM
Why Our Brains Are Wired to Make Bad Investment Decisions
Behavioural finance research consistently shows that investors tend to sell near market bottoms and buy near market peaks — the exact opposite of what creates wealth. This isn’t a failure of intelligence. It’s a feature of how human beings process risk and uncertainty.
When headlines scream “war,” “oil crisis,” and “market crash,” the instinct to exit, pause SIPs, or move everything to fixed deposits feels rational. Historically, it is one of the most costly decisions an investor can make.
“The stock market is a device for transferring money from the impatient to the patient.” — Warren Buffett

The antidote is not willpower. It is a framework that makes the decision before emotions arrive.
03 — THE FRAMEWORK
Introducing the Equity Valuation Index (EVI)
The EVI, developed by ICICI Prudential AMC, answers a simple but powerful question: at this moment, are Indian equities cheap, fairly valued, or expensive? It blends four equally-weighted parameters:
● P/E Ratio – How much investors are paying per rupee of corporate earnings
● P/B Ratio – Market price relative to the book (accounting) value of assets
● G-Sec × P/E – Equity premium over government bond yields — the opportunity cost of being in equities
● Market Cap/GDP – How large the stock market is relative to the economy — the “Buffett Indicator” of overall valuation

04 — READING THE SIGNAL TODAY
EVI POSITION — FEBRUARY VS MARCH 2026

In February 2026, the EVI stood at ~108.8 — in the Neutral band. After the March sell-off, it moved to ~97, shifting into the “Invest in Equities” zone. The market’s pain had, objectively, created value. This is not a guarantee of near-term returns. What the EVI offers is something rarer: a data-backed anchor when the emotional pull to act defensively is at its strongest.
This is the kind of signal that gets drowned out by the noise of daily news — but historically, it has been among the most important ones to pay attention to.
To put this in context: over the 20-year history of the EVI (2006–2026), periods where the index dipped into the “Invest in Equities” zone have consistently been associated with above-average forward returns over a 3–5 year horizon, based on back-tested data. The EVI hit its deepest levels during the 2008–09 subprime crisis, the 2016 European crisis, and the March 2020 COVID sell-off — all of which, in hindsight, were generational buying opportunities.